The Facts—Confronting our local and statewide crisis

Fact: We need to build more housing
“The California Department of Housing and Community Development estimates the state needs to build 180,000 new units of housing annually by 2025 to meet projected growth, over 100,000 more units than we are currently building annually.
Between 2011 and 2015, the Bay Area added over 500,000 jobs, but only 65,000 housing units. That’s 1 unit of housing for every 8 jobs created.” - Bay Area Council, (2015), Legislative Analyst's Office, (2015)
Fact: Housing has become unaffordable for most
The average monthly rent in California is 50 percent higher than the rest of the nation and even higher in cities such as San Francisco, San Jose, Oakland, and Los Angeles.
The poorest 25 percent of households report spending four times more of their income (67 percent, on average) than households in the top quarter of the income distribution (16 percent, on average) [on housing costs]. Legislative Analyst's Office, (2015)

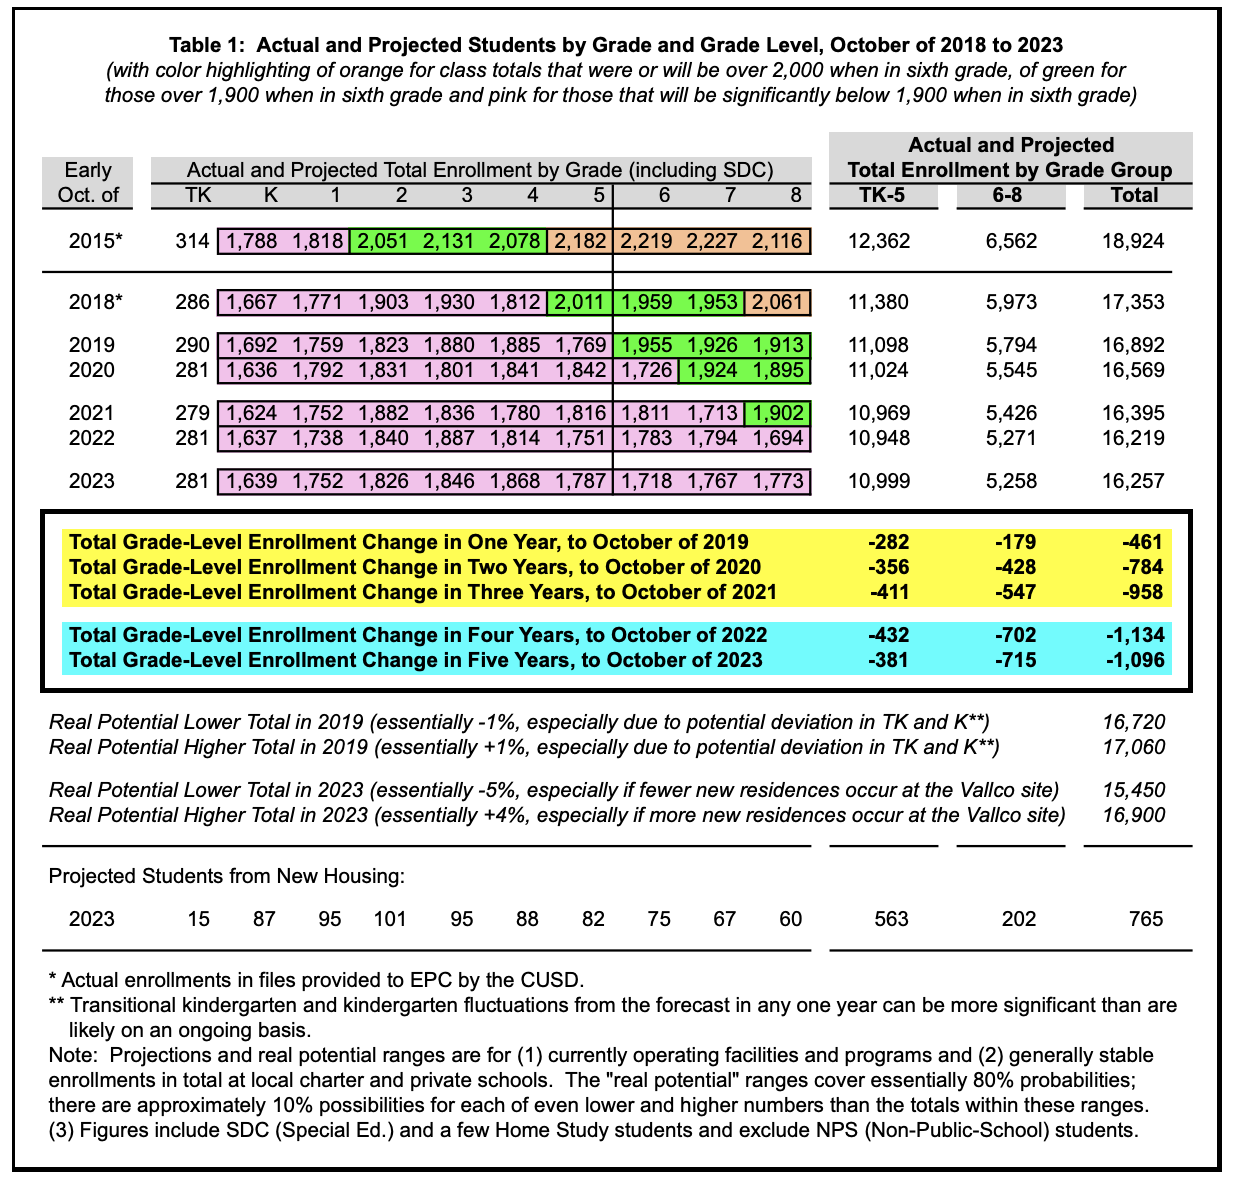
Fact: A lack of housing has been devastating for the school district, leading to enrollment/budget issues and school closures
Total enrollment in the Cupertino Union School District (CUSD) rose by over 5,500 students, or more than 40%, in the two decades up to the 2013-14 school year and then abruptly shifted into decline, in losing over 1,800 students, or nearly 10%, in the last five years. More than two-thirds of that reduction occurred in just the last two years, so the degree of decline has rapidly increased. Soaring housing costs are assumed to be the main cause of this radical shift, with fewer young families able to move into the district and the continuing families aging past the childbearing years.
Further decline in the birth totals since the last year of available data (2016) and/or fewer new housing units being built than are projected could instead create continued enrollment decline. There also is the alternative possibility of more new housing being completed, especially at the Vallco site, which could make the enrollment rebound more notable.

Fact: Our youth are being hit hardest
In 2018, 18% of respondents [among De Anza students] answered affirmatively to at least one of the items indicating [homelessness] compared with a regional average of 15% and a national average of 14%.
10% of students indicated that they didn’t have a home sometime during the past 12 months compared with 2% of the national average
8% of students indicated that they stayed in a vehicle, abandoned building, or other place not meant as housing at any time during the past 12 months compared with 4% of the national average. DeAnza College, (2018)
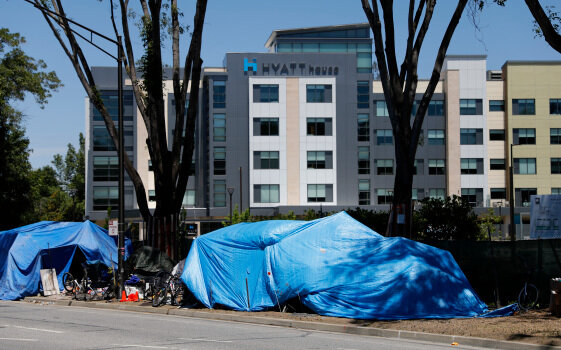
Fact: High housing costs are the driving cause of homelessness
More than half of Santa Clara County’s homelessness is due in part to lost jobs or evictions, and in just the last year alone, only 7 percent to 8 percent of new housing units were considered affordable - San Jose Spotlight, (2019)
As a result of our housing crisis, 1 in 3 young adults in the region live with their parent, and nearly a quarter of Silicon Valley residents live in multi-generational homes for economic reasons. San Jose Spotlight, (2019)
Newer and younger homeowners are also heavily disadvantaged now, with extremely high multimillion housing costs, while those who bought earlier have seen massive profits. 20% of Bay Area homeowners - 250k homes - are estimated to be Housing Millionaires, meaning their wealth has grown by $1m+ bc of their home.
While the average new homeowner in the Bay Area pays 1.26% in property tax, Housing Millionaires only pay 0.4% on average. Tax Fairness Project, Prop 13 Reform

Fact: This housing shortage is increasing climate change
Local bans on attached homes in cities are driving up energy use and helping cook the climate, the United Nations Environment Program wrote in a report published in 2019.
“In some locations, spatial planning prevents the construction of multifamily residences and locks in suburban forms at high social and environmental costs” the report’s authors wrote. They suggest a 20 percent cut to average floor area per person by 2050. Commentary by Sightline, (2019)

Fact: Our failure to plan for enough housing has led to increased car use and reliance
The lack of affordable housing has lead to a decrease in public transit use. Three quarters of people commute to work in cars from longer distances in the valley, causing significant traffic congestion of “at least 50 minutes weekly per commuter.” San Jose Spotlight, (2019)
“One driver of [transit] ridership loss that stood out among the rest: the impact of the economic displacement of low-income earners from inner city neighborhoods to first ring suburbs.” Transit Center, (2017), "In Portland, Economic Displacement May Be A Driver of Transit Ridership Loss"
Within Transit Oriented Development areas, all income groups own cars at a rate that is at least 30% lower than non-TOD areas. [TOD areas tend to promote a degree of density to maximize transit ridership and reduce distance to a transit station]

Fact: We are increasing poverty and segregation in the process
The poverty rate among Latino and African American residents are nearly three times higher than those of white residents, resulting in more than 57 percent of Latino households in Silicon Valley failing to meet self-sufficient standards.
UC Berkeley’s Othering & Belonging Institute finds that the Bay Area was more racially segregated in 2010 than it was 40 years prior, in their comprehensive report, “Racial Segregation in the San Francisco Bay Area”.
This report features maps highlighting distinct patterns of segregation for Black, Asian, Latino, White, and Native American populations, with an accompanying interactive web tool.
Cupertino has a divergent score of 0.3, indicating a high level of segregation. The report’s authors find:
Rounding out the top 10 most segregated cities in the Bay Area is Cupertino, the largest city in the top 10 (with a population of more than 58,000 people and the location of the corporate headquarters of Apple). Cupertino is also the only city in the top 10 most segregated cities that is predominantly Asian (63 percent). Clearly, segregation comes in many forms. But the most segregated white and/or Asian cities tend to be those with a higher-than-average percentage of single-family-only zoning.