Housing
Overview
Cupertino has serious housing problems. Across income and age ranges, finding an opportunity to live in Cupertino is rare and often unaffordable. Data over the past decade help illustrate this reality, clear and objectively:
In the past decade, the number of homes increased 0.1%, and the types of housing have remained nearly unchanged. 1
The price of housing dramatically increased: the median home price more than doubled, at nearly $2.5 million dollars. 2 Rents are typically above 3,000 a month, meaning that even a household making over $100,000 annually would be cost-burdened to rent a typical apartment in Cupertino. 3
During the same decade, the number of jobs increased nearly 60%, but in the last five-years, school enrollment has consistently declined. 4 The increase in jobs amidst declining school enrollment suggests that many new community members (local workers) cannot afford- or find the opportunity- to live in Cupertino.

Jobs vs Housing
Cupertino’s jobs to households ratio has nearly doubled since 2002.
As prices for homes surge--both rent and for sale--fewer families are able to afford moving into the Cupertino School District. This, along with other short-term factors such as a shift towards private schools, has led to chronic enrollment decline, placing our school district in financial jeopardy.

Declining Enrollment
Recent CUSD demographer reports continue to project declining enrollment well through 2025.
The Cupertino union school district on declining enrollment:

Answer above is directly from the CUSD’s School Closure FAQ.
Housing Production
Housing units from 2010-2020

“Housing Type Trends” from Housing Needs Data Report: Cupertino (2021). Over a decade, the number of housing units have barely changed.
Recent Housing needs report findings:
“In Cupertino, the largest proportion of the housing stock was built 1960 to 1979, with 10,462 [homes] constructed during this period [see the Figure above, or Figure 20 in the report]. Since 2010, 2.3% of the current housing stock was built, which is 502 [homes]."
Current Progress:
“RHNA” = Regional Housing Needs Allocation. This statewide mandate represents how many units a municipality ought to have to meet housing needs, and is measured by permits issued because municipalities typically do not directly build housing units. See more information on the Bay Area’s allocations here.
Permitting activity is significantly lower than our current RHNA allocations for the 2015-2023 cycle, demonstrating a clear lack of results on housing growth, particularly for low and very-low income affordability tiers.

Under current zoning regulations, this duplex is illegal to build on 91% of residential-land in Cupertino.

A zoning map of Cupertino. More information and data can be found here.
2021 Area median income (AMI):
Defined at a County level, “AMI” determines different tiers of housing affordability.

Based off 2021 HUD determinations of the “Area Median Income” for Santa Clara County.
Note for comparison that the most recent statewide median annual household income is $75,235, and is $67,521 across the country. Depending on the household size, both these median income levels could be defined as “very-low income” in Cupertino.
Not just Cupertino: Impacts throughout the Bay
The impacts from the absence of housing opportunities, in particular for lower-income workers, are far and wide-reaching. For example, we can see the impact on commute times below:

Commute Times for Residents in 2018. MTC Vital Signs Project.

Commute Times for Workers in 2018. MTC Vital Signs Project.
The juxtaposition of resident versus worker commuter times shows how dwindling housing supply impacts other communities in the Bay: workers going to job centers face increased commute times as lack of housing pushes them further away from their place of employment.
Housing & the environment
Housing affects environmental issues - especially climate change - in significant ways as well. At a high-level, housing choices impact:
greenhouse gas emissions resulting from transportation, energy usage, and home-appliances
direct impacts on habitats and risk of exposure to environmental dangers, such as wildfires
Newer homes are more energy efficient, and present crucial opportunities for decarbonization and cost-savings because they represent chances to prevent locked-in emissions (future emissions associated with from an inefficient air conditioner, or a gas heater heater over its lifetime). In the same manner, preventing gas hookups in future construction is another important way housing impacts our fight against climate change (see here for a helpful discussion and resources on this topic).
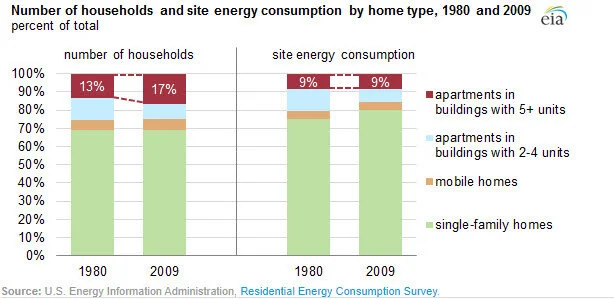
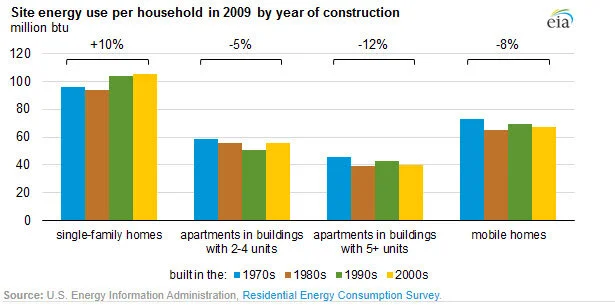
The types of communities we build will matter for fighting climate change: apartment buildings use less energy than other types of housing, and higher density housing can have a wide range of co-benefits ranging from better air quality, local economic activity, to physical and mental health outcomes.
Studies5 have established that higher density housing patterns are linked to lower greenhouse gas (GHG) emissions. Transit-oriented development, or development near transit options, will help develop more robust transportation networks and reduce vehicle-miles travelled (VMT), which will be a key-indicator for decarbonization.

Nationally, transportation-related emissions have surpassed power-sector related emissions, and for California, transportation-related emissions are the largest source of GHG emissions.
Over the last 17 years, California’s transportation-related emissions have seen little to no decrease, and recent research on decarbonization scenarios within the transportation sector re-emphasizes the need for reducing VMT. The study finds that while electric car use will be important, it cannot be our only policy: EV adoption will need to be combined with massive increases in all alternative transportation methods, including but not limited to transit (bus, rail), biking and walking. Despite Cupertino’s relatively high (14% vs. <1% nationwide) EV adoption rates, these findings should remind us that encouraging alternative methods of transit will be just as (or more) important than using electric vehicles.

Both of these charts are found in this report, and all of this data can be queried and downloaded here.

From this thread here
Cupertino & Climate Change

59.2 CO2e per year
is the average household carbon footprint in the 95014 zip-code.
Images from UC Berkeley researchers’ “CoolClimate Maps”, displaying average household carbon footprints by zipcode.
Similar to statewide trends, Cupertino’s community GHG emissions for transportation are nearly equal to largest GHG source (energy-use from natural gas).
Reducing both of these GHG sources will involve housing policies:
For natural gas emissions: actions like the enforcement of REACH codes for new developments, and the exploration of other programs or strategies for appliance replacements, as well as electric-only building conversions for commercial and residential natural gas consumers
For transportation: public policy positions, like support of VTA BRT (Bus Rapid Transit, a.k.a a dedicated bus lane) projects, as well as policy changes, like the removal of parking minimums and height restrictions preventing the development of denser, transit-oriented housing developments, will be crucial (and are even partially acknowledged within Cupertino’s 2018 Climate Action Plan Progress Report)
With Housing for all, a Cupertino for all
Housing matters, especially in Cupertino. We have a chance to positively impact and shape the very community we live in by advocating for inclusive housing policy changes in Cupertino. By lending your voice in support of a more inclusive and sustainable future for Cupertino, you can influence change impacting not only the generations here today, but also for those living here in the years to come.
Get involved in this fight for a Cupertino for all here, and learn more about our organization here.
Footnotes
1 Housing Needs Data Report: Cupertino (2021)
2 The median price of a home (checked in July 2021) was 2.46 million. Zillow, 2021.
3 Zumper, 2021. RentCafe, 2021. Housing Needs Data Report: Cupertino (2021). A household spending more than 30% of their income is considered cost-burdened (HUD).
4 Based on CUSD enrollment information and EdData CUSD profile.
5 Established within this paper’s footnotes 18, 31, and 32, as well as reinforced by its findings as well. PNAS August 11, 2020 117 (32) 19122-19130; first published July 20, 2020; https://doi.org/10.1073/pnas.1922205117